
For more information about the CRDA, contact:
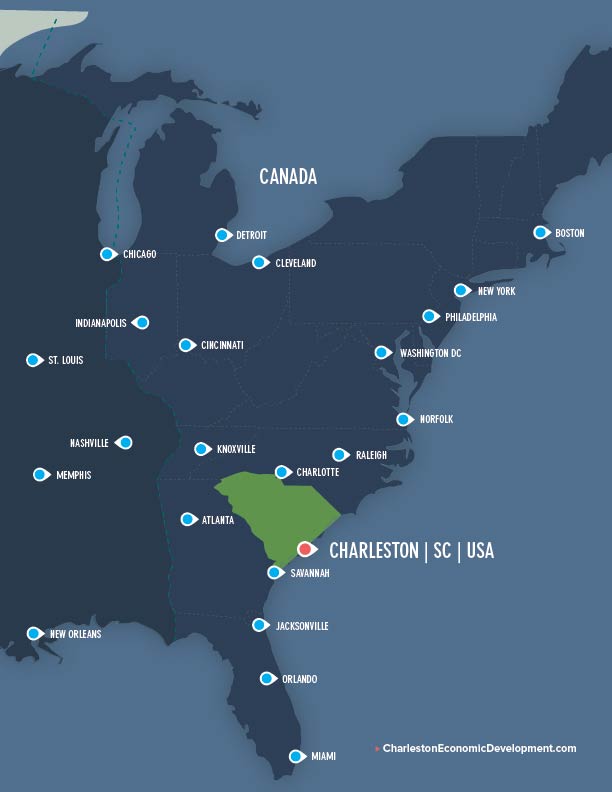
Charleston offers the workforce and talent companies need to succeed and grow. Even with recent successes such as Boeing, Volvo, and Daimler expanding in the market, Charleston MSA’s labor pool offers more opportunities for continued business growth. Since 2010, it has grown 3 times faster than the U.S. average and twice as fast as South Carolina’s average.
Source: U.S. Census Bureau
Source: SC Works
Source: Apprenticeship Carolina
Source: U.S. Dept of Education
% of population 25+
Source: U.S. Census Bureau
Source: U.S. Bureau of Labor Statistics
In fiscal year 2022, ReadySC, a free, customized workforce training program for qualifying companies creating new jobs in the Charleston region, trained more than 5,700 skilled workers for 115 local manufacturers and suppliers.
Property tax incentives, sales tax exemptions, and special discretionary incentives at the local and state levels. Plus, there are many ways to reduce, or even eliminate, your company's corporate income taxes.
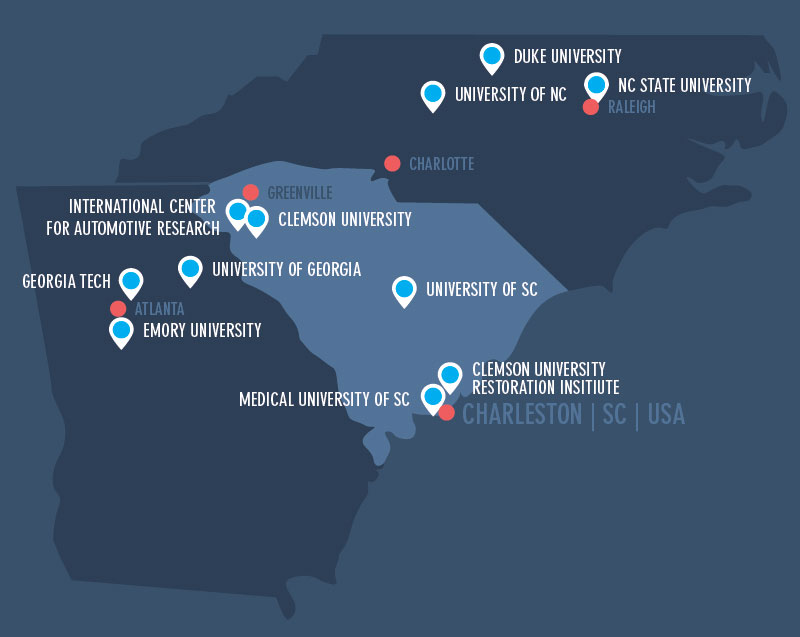
view incentivesThe Charleston region is home to more than 20 colleges and universities that produce highly-skilled talent, drive groundbreaking research and technological breakthroughs, and build a globally competitive market. We are nurturing locally grown innovation, aligning education with business, and commercializing technologies.

The Charleston region is home to more than 20 colleges and universities that train the local workforce, drive groundbreaking research and technological breakthroughs, and build a globally competitive market.
Nurturing locally grown innovation.
 view all colleges
view education resources
view all colleges
view education resources
For more information about the CRDA, contact:
[email protected] or call us at +1 843.767.9300