
For custom data and insights, contact:
An international travel destination consistently voted the number one city in the U.S. and number two on the World’s Best Cities list by top travel magazines, Charleston is home, workplace and inspiration to countless voices, talents, and passions.
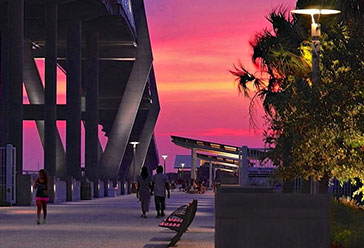
Residents enjoy a lifestyle that strikes the perfect balance between work and play – and a warm climate, culture, food, attractive cost of living, European sensibilities, miles of beaches, diverse housing options, and one of the best medical hubs in the Southeast. Called a ‘millennial talent magnet’ by USA Today due to the growth of the creative class and skilled talent, the Charleston region retains its unique identity and while offering a wealth of job growth and career opportunities.
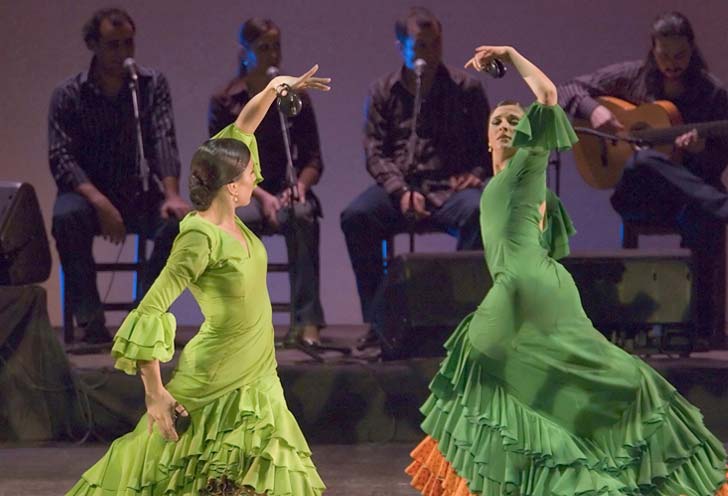
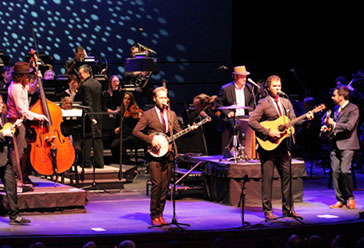
AmericanStyle magazine named the Charleston area as one of the top five arts destinations in the United States. From classical music, museums, ballet, contemporary theatre, and improv to art galleries, poetry slams, jazz, rock, world beat, and blues, there’s always something to excite the mind and inspire the spirit.

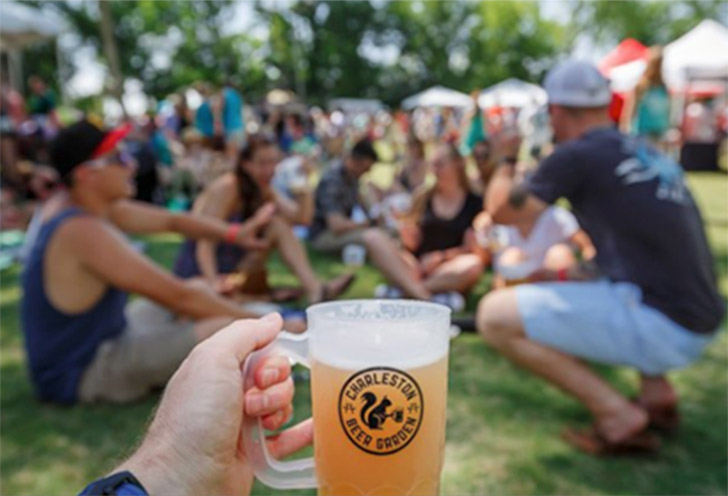
Eat, drink, and be merry. Whether you’re a foodie hungry for fresh, local cuisine prepared by James Beard award-winning chefs, a music fan in the front row, or an outdoor enthusiast enjoying a post-adventure craft beer, you’ll find plenty to keep you engaged and inspired.

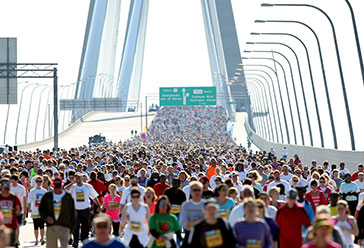
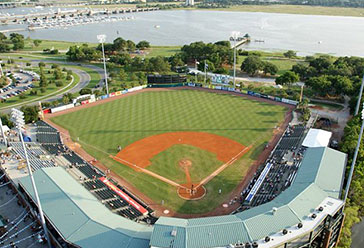
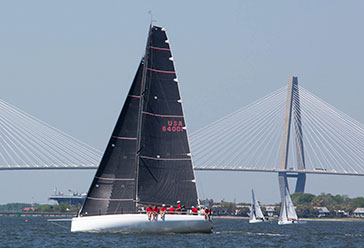
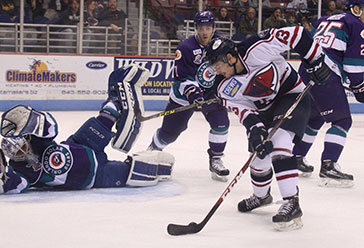
Professional baseball, hockey, and soccer teams, college and university teams, and an array of annual races, tennis, and golf tournaments made to satisfy even the most die-hard fans and athletes


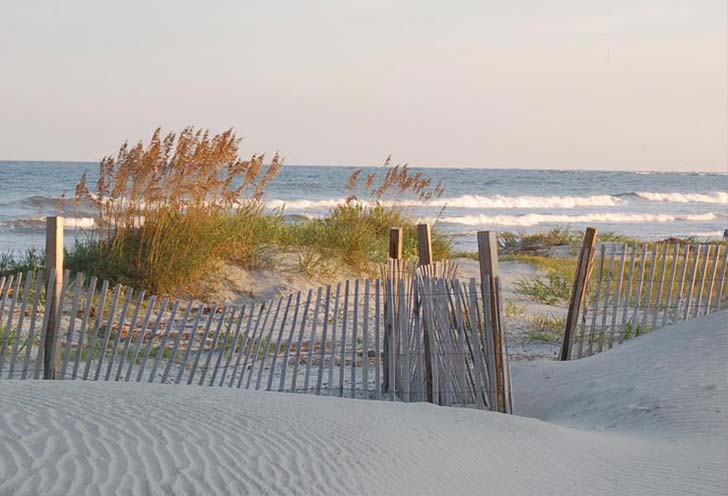
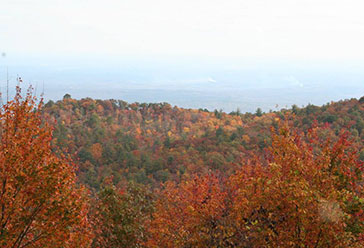
Miles of award-winning beaches and waterways, parks and preserved lands on which to play, ski, kiteboard, paddle, surf, explore, and roam. For more information on ways to play and explore South Carolina visit, DiscoverSouthCarolina.com.
For custom data and insights, contact:
[email protected] or call us at +1 843.767.9300